


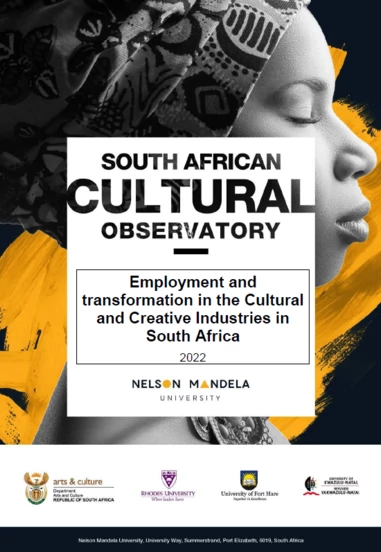
This report forms one chapter of the SACO 2020 CCI Mapping Study. Aims were to analyse the number and proportion of people in South Africa who are employed in the cultural economy, as well as changes in the size, transformation, age, gender, education lev
Overview
This report forms one chapter of the SACO 2020 CCI Mapping Study. Aims were to analyse the number and proportion of people in South Africa who are employed in the cultural economy, as well as changes in the size, transformation, age, gender, education levels and working conditions of those in cultural occupations since the last mapping study, using official national data sets from Statistics South Africa. New analysis of the Post Apartheid Labour Market Series (PALMS), which covers a 20-year time period, was also included. Methods used to identify cultural occupations and industries are those set out in the UNESCO Framework for Cultural Statistics (FCS, 2009) and the recent UNESCO Indicators for Culture 2030, adapted for South Africa (Hadisi and Snowball, 2016).
Using the “cultural trident” method, findings showed that creative economy employment has increased, from making up 6.72% of all jobs in South Africa in 2015 to 7.03% in 2017, which accounts for 1,14 million jobs. Another important finding is that the number of cultural occupations continues to grow at a faster rate (7.1% between 2016 and 2017) than other jobs (2.3% growth between 2016 and 2017).
The largest domain, in terms of employment, remains Visual Arts and Crafts (44%). PALMS data showed that the domain with the fastest growth between the Post-Apartheid era (Period 1,1996 – 1999) and post the financial crisis (Period 3, 2010- 2016) was Audio-Visual and Interactive Media, which also had the second highest average earnings (R21 000 per month in 2015 prices) for Period 3. This domain also stands to benefit from the change in cultural policy focus from the more traditional domains (the subsidised arts, focused on in the 1996 White Paper) to a broader conception of the cultural and creative industries (included in the Revised White Paper, 2017).
Cultural occupations are becoming more racially representative over time, with 84% of people in cultural jobs in 2017 being black (including African, coloured, or of Indian or Asian descent) compared to only 73% in Period 1. Young people in cultural occupations are also more racially representative than older groups.
In both cultural and non-cultural occupations, there has been a decline in formal sector employment since the last mapping study. 46% of people working in cultural occupations were in the informal sector in 2017. A much higher proportion of cultural workers are freelance (34%) than non-cultural workers (10%). Education levels of people working in cultural occupations remain higher than those in non-cultural occupations. The PALMS data shows that there has been a particularly fast increase in the proportion of people in cultural occupations with tertiary education, from 17% in Period 1 to 27% in Period 3.
The highest proportion of cultural jobs is still found in Gauteng (29.4%), followed by the Western Cape (18%) and KwaZulu-Natal (17%). Although they have much smaller overall shares of cultural employment, Limpopo (9.4% of cultural occupations) and Mpumalanga (7.7% of cultural jobs) both have location quotients of slightly above 1, indicating a potential for comparative advantage in the sector.
Domains that are struggling are Books and Press, which has lost a considerable number of jobs since 1996, and Visual Arts and Crafts, which remains the largest in terms of number of cultural jobs, but has the lowest average earnings of any domain.
Related Reports
Join Our Mailing List